VB Stats: Track, Understand, and Win with Volleyball Statistics
The complete guide to volleyball statistics for coaches. Learn what to track, how to analyze it, and the tools that make it effortless.
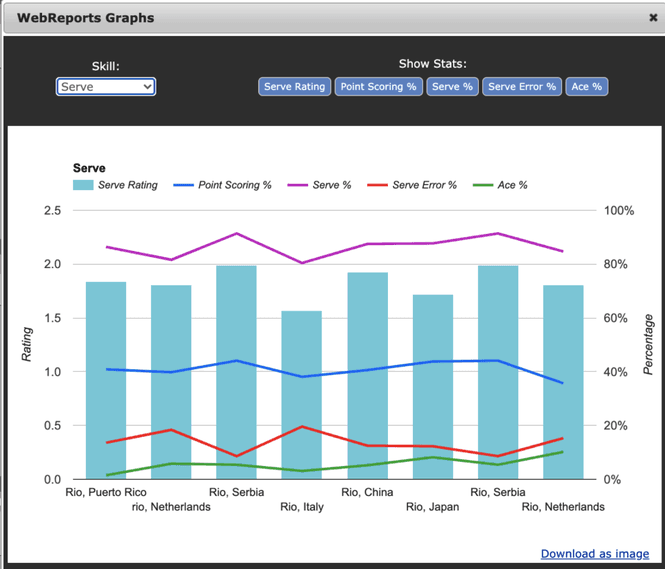
Volleyball Graphs & Charts
A strong volleyball graph or chart turns rows of numbers into decisions: hitting % trends by match, rotation efficiency by set, and serving patterns over a tournament. Volleyball charts in tools like WebReports help you spot who is heating up and which rotations leak points — without rebuilding spreadsheets after every weekend.
When you're ready to visualize performance automatically, open the volleyball analytics dashboard (WebReports) for trend reports and team visuals synced from SoloStats123.
Complete Guide to Volleyball Statistics
Volleyball statistics are the foundation of data-driven coaching. When you track volleyball stats consistently—kills, errors, assists, serve quality, pass quality—you get a clear picture of what’s working and what isn’t. Accurate numbers help you identify strengths, weaknesses, and areas for improvement without relying on memory or guesswork.
This hub covers everything from basic stat tracking methods to advanced analytics platforms. You’ll learn how to choose the right tools for your team, understand key volleyball statistics, and use data to make better coaching decisions.
Start with free printable stat sheets or jump into digital tracking with SoloStats123. Compare options in our guide to the best volleyball stat apps. As your needs grow, explore WebReports for advanced analytics and SoloStats Coach for mobile access.
What VB Stats Are Tracked in a Match
In a typical match, coaches and stat keepers record both team and individual metrics. On the offensive side, the main volleyball stats are kills (successful attacks that end the point), hitting errors (attacks that go out, into the net, or are blocked for a point), and attempts (total swings). Hitting efficiency is then calculated as (Kills − Errors) ÷ Attempts, giving you a single number that shows whether an attacker is helping or hurting the team.
Serve and serve receive are tracked with quality scales. Serve quality is often rated 0–4: 0 for a service error, 1 for an easy pass, up to 4 for an ace. Pass quality (serve receive) is usually 0–3: 0 for a reception error, 1 for out-of-system, 2 for playable, 3 for a perfect in-system pass. These scales let you see who’s holding up under pressure and which servers are creating the most trouble.
Other common volleyball stats include aces, blocks (solo and assist), digs, assists (sets that lead to a kill), and sideout percentage—the percentage of times your team wins the point when receiving serve. Many teams also track rotation-by-rotation performance to find weak links. The exact set of stats you track depends on your level and goals, but the ones above form a solid core for most programs.
VB Stats by Position
Position-based stat goals help coaches avoid one-size-fits-all evaluations. Track the same match, but read each role through a different lens. For a breakdown of which stats apply to each role, see the volleyball positions guide.
Setter VB Stats
For setters, focus on assists, assist-to-error ratio, set distribution, and sideout success when they are front row versus back row. Pair raw assists with team hitting efficiency to see whether the offense is actually improving.
Outside Hitter VB Stats
Outside hitters carry volume, so kills alone are incomplete. Prioritize attempts, hitting efficiency, terminal kill rate in out-of-system balls, and serve receive quality if they pass six rotations.
Libero/Defensive Specialist VB Stats
Liberos and DS players should be evaluated by pass quality distribution, dig quality, and error rate under pressure. Track perfect-pass percentage and how often their first contact keeps the offense in system.
Middle Blocker VB Stats
Middles impact both sides of the ball. Watch block touches, block kills, hitting efficiency on quick sets, and transition scoring speed to understand how they change rally outcomes.
For deeper benchmarks and coach education resources, review AVCA resources alongside your team reports.
Why Tracking Volleyball Statistics Improves Coaching Decisions
Without written stats, decisions tend to be driven by the last play or the loudest opinion. Tracking volleyball stats gives you an objective record. You can see which hitter is actually efficient over a full match, which server is earning aces or forcing errors, and which rotations are losing points. That makes it easier to adjust lineups, set matchups, and give specific feedback in practice.
Stats also improve accountability and focus. When players know their numbers are being recorded, they often sharpen their execution. Coaches can set goals (e.g., “we need to sideout above 60%”) and then check whether the team hit the target. Over a season, trends in hitting efficiency, serve quality, and pass quality show whether training is working and where to double down or change course.
Finally, these metrics make conversations with players and parents more productive. Instead of “you need to hit better,” you can point to efficiency, error rate, or pass ratings and tie feedback to concrete numbers. That builds trust and makes improvement measurable.
How to Read and Interpret Volleyball Statistics
The first step is to use consistent definitions. If one match “kill” means any attack that scores and the next means only hard-driven spikes, your numbers won’t be comparable. Adopt a clear standard (e.g., same as your league or MaxPreps) and stick to it for every match.
When you look at hitting efficiency, positive is good and negative is bad—but context matters. A middle who hits .400 on 10 attempts is efficient; an outside who hits .200 on 40 attempts might be carrying a large load. Compare players in similar roles and look at trends over several matches, not just one. For serve and pass quality, focus on averages and on who’s at the extremes: your best and worst passers, your most and least effective servers.
Sideout percentage is one of the best summary stats. High sideout (e.g., above 60%) usually means your serve receive and offense are in good shape; low sideout points to passing or attacking issues. Use it to decide where to spend practice time. Finally, don’t let one stat drive everything. Combine hitting efficiency, serve and pass quality, and sideout to get a full picture before making big lineup or strategy changes.
Tools Coaches Use to Track Volleyball Statistics
The oldest method is the paper stat sheet: a grid or spreadsheet you print and fill in by hand. It’s cheap and works anywhere, but calculations and totals are manual and mistakes are easy. Many coaches start here to learn the flow of the game and which stats they care about most.
Digital spreadsheets (e.g., Google Sheets or Excel) add automatic formulas and easy sharing. You still enter each event by hand, but totals, efficiencies, and percentages update on their own. The next step up is a dedicated stat app. Apps like SoloStats123 use a simple 1-2-3 flow (point outcome, then attacker, then type of attack or error) so you can keep up with live play. Some apps support voice input or tablet interfaces so you can track without looking down.
For deeper analysis, coaches pair a tracking app with an analytics or reporting platform. WebReports, for example, takes data from SoloStats and turns it into trends, player comparisons, and rotation breakdowns. That’s where statistics move from “what happened” to “what it means.” Choose a tool that matches your time and level: paper or spreadsheet to start, then consider an app and reporting when you’re ready to go further.
Key Points
Start Simple
Begin with free printable stat sheets or basic tracking apps before investing in advanced analytics.
Track Consistently
Use the same method and definitions for every match to ensure comparable statistics across the season.
Focus on Key Stats
Prioritize hitting efficiency, serve quality, and pass quality for maximum coaching value.
Use Analytics
Advanced platforms like WebReports reveal trends and patterns that simple totals miss.
Volleyball Statistics Resources
Explore our complete collection of volleyball statistics resources. Each resource covers a specific aspect of stat tracking, from basic methods to advanced analytics.
Volleyball Stat Sheet
Download free printable volleyball stat sheets (PDF & Google Sheet) for manual stat tracking.
Volleyball Stat Software
Compare volleyball stat tracking software solutions and find the best fit for your team.
How to Track Volleyball Stats
Complete guide to tracking volleyball statistics using printable sheets, spreadsheets, or apps.
Best Volleyball Stat Apps
Compare the best volleyball stat apps for 2025, including free and paid options.
SoloStats123
Free volleyball stat tracking app with simple 1-2-3 button flow and automatic calculations.
SoloStats LIVE
Fast in-rally stat tracking app designed for capturing every touch during fast-paced rallies.
SoloStats Voice
Hands-free voice stat tracking that lets you keep your eyes on the game while recording stats.
SoloStats Touch
Touch-based stat tracking interface optimized for tablet and large-screen devices.
WebReports
Advanced volleyball analytics and reporting with trend analysis and player comparisons.
SoloStats Coach
Mobile access to your stats during matches with AI-powered coaching insights.
Definitions
Understanding volleyball statistics requires clear definitions. Here are key terms you'll encounter:
Hitting Efficiency
(Kills - Errors) ÷ Attempts. Measures attack effectiveness.
Pass Quality
0-3 scale measuring serve receive accuracy and setter accessibility.
Serve Quality
0-4 scale measuring serve effectiveness and opponent pass difficulty.
Sideout Percentage
Percentage of opponent serves that result in your team winning the point.
Steps to Effective Stat Tracking
Choose Your Method
Start with free printable stat sheets or try SoloStats123 for digital tracking.
Learn the Basics
Read our complete tracking guide and volleyball stats hub to understand essential statistics and tracking methods.
Track Consistently
Use the same method and definitions for every match to ensure comparable statistics.
Analyze Results
Use WebReports to identify trends and patterns in your team's performance.
Ready to track VB stats automatically? Try SoloStats free →
Frequently Asked Questions
What are vb stats?
Volleyball stats are numerical measures of player and team performance during a match, such as kills, errors, assists, serve quality, pass quality, and sideout percentage. They give coaches an objective view of what’s working and what isn’t.
How do you track volleyball stats during a match?
You can track volleyball stats with a printed stat sheet and pen, a spreadsheet (e.g., Google Sheets), or a dedicated stat app like SoloStats123. Apps use a simple flow (point outcome, then player, then stat type) so you can keep up with live play; some support voice or tablet entry.
What is the best app for vb stats?
The best app depends on your needs: SoloStats123 is a popular free option with a 1-2-3 button flow and automatic calculations. For faster in-rally tracking, SoloStats LIVE is built for speed; for hands-free entry, SoloStats Voice lets you call out stats. All integrate with WebReports for deeper analytics.
What does each vb stat mean?
Kills are successful attacks that score; errors are attacks that lose the point. Hitting efficiency = (Kills − Errors) ÷ Attempts. Serve and pass quality use 0–4 and 0–3 scales. Sideout percentage is how often you win the point when receiving serve. See our definitions page for full explanations.
Related Tools
Explore the complete SoloStats ecosystem of volleyball coaching tools: