Performance Benchmarks
Compare your team's performance against national benchmarks. We've analyzed over 1,000,000 games from Club 12U all the way up to College teams to identify the key stats that correlate most to winning at each level.
Latest Report - College to Club 12U
We have analyzed more than 1,000,000 games from Club 12's all the way up to College teams. We've found the key stats that correlate most to winning or losing at each level of play. Our latest report includes boy's and men's stats. We presented our findings at the 2016 AVCA Convention in Columbus.
Benchmark Charts by Age Group
Below are performance benchmarks for different age groups and competition levels. Each chart shows the distribution of key statistics and how they correlate to win percentage. Use these benchmarks to understand where your team stands and identify areas for improvement.
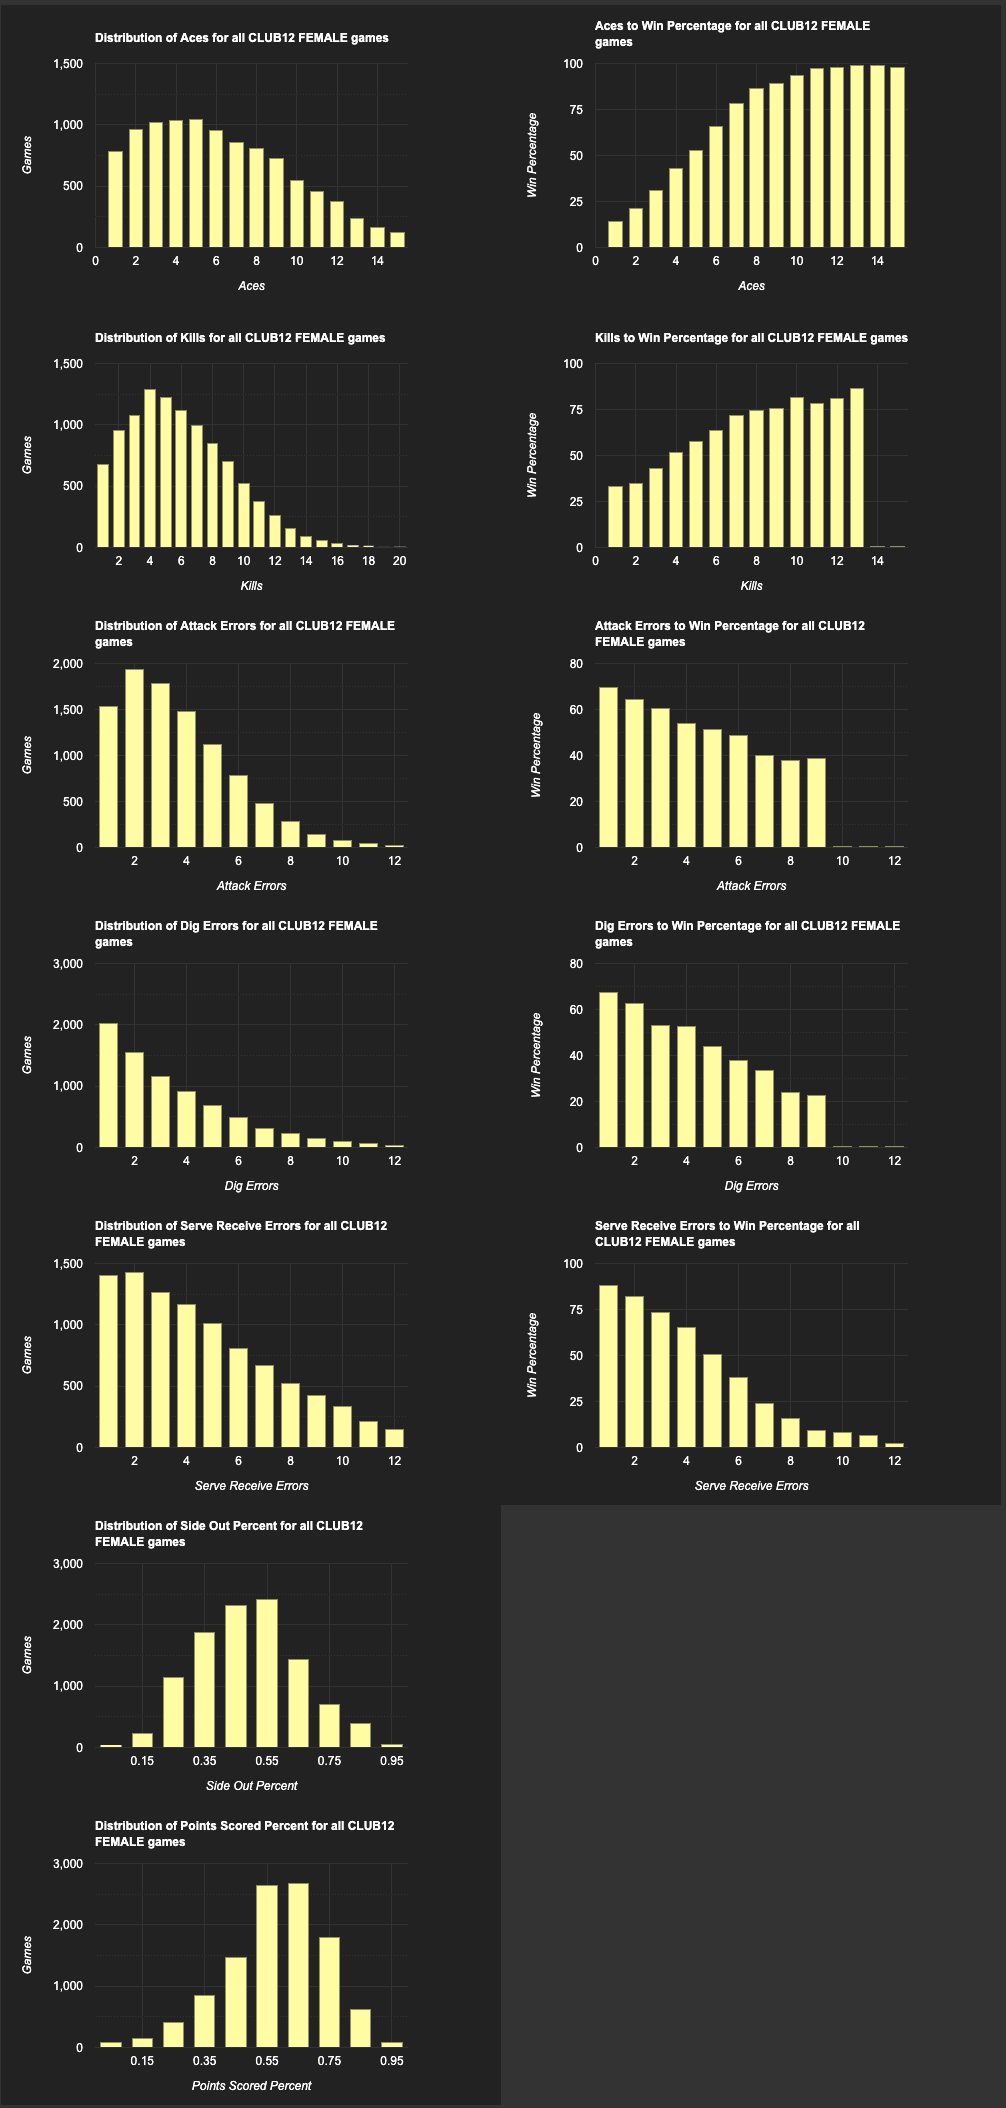
Club 11-12
Ages 11-12
Understanding the Benchmarks
Distribution Charts
The left column shows how frequently different stat values occur across all games at that level. This helps you understand what's typical for your age group.
Win Percentage Charts
The right column shows how each stat value correlates with winning. Higher aces and kills increase win percentage, while errors decrease it.
Key Findings: What Stats Correlate with Winning
After analyzing over 1,000,000 games, we've identified which skills have the strongest correlation with winning at each level. These findings reveal what actually matters for success—not just what's easy to measure.
Aces: Strong Positive Correlation
Teams with more aces consistently show higher win percentages across all levels. The data shows a clear pattern: aggressive, accurate serving directly translates to victories. This isn't just about scoring points—aces disrupt opponent offense and create momentum shifts that compound throughout the match.
Takeaway: Investing in serve training pays dividends. Teams that prioritize serving accuracy and aggressiveness see measurable improvements in win rates.
Kills: The Offensive Foundation
Kill percentage shows one of the strongest correlations with winning. Teams that terminate rallies effectively win more matches—this holds true from 12U club to college. The relationship is particularly strong because kills represent successful execution of the entire offensive system: passing, setting, and attacking.
Takeaway: High kill rates indicate well-coordinated offense. Focus on improving the entire offensive chain, not just individual hitting skills.
Serve Receive Errors: The Strongest Negative Correlation
Of all the stats we track, serve receive errors show the strongest negative correlation with winning. Teams with clean serve receive win significantly more matches. This finding is consistent across all age groups and levels—poor passing doesn't just lose points, it prevents your offense from functioning.
Takeaway: Serve receive is the foundation of everything else. Teams that minimize serve receive errors give themselves a massive advantage, regardless of other skill levels.
Attack Errors: Costly Mistakes
Attack errors have a strong negative correlation with winning. While aggressive hitting is necessary for kills, unforced attack errors directly hurt win percentage. The data shows that teams with lower attack error rates win more matches, even if their kill totals are similar.
Takeaway: Balance aggression with control. Teams that reduce unforced attack errors while maintaining kill production see improved win rates.
Dig Errors: Defensive Breakdowns
Dig errors negatively correlate with winning, though the relationship varies by level. At higher levels, dig errors become more costly as rallies become longer and each touch matters more. Teams that minimize dig errors keep rallies alive and create more scoring opportunities.
Takeaway: Defensive consistency matters. Teams that reduce dig errors extend rallies and give themselves more chances to score.
Side Out Percentage: The Efficiency Metric
Side out percentage measures your team's ability to score when receiving serve—essentially, how well you convert serve receive into points. This metric shows a strong positive correlation with winning because it reflects overall offensive efficiency. Teams with higher side out percentages win more matches because they capitalize on opportunities.
Takeaway: Side out percentage captures the entire offensive system in one number. Improving this metric requires coordination across passing, setting, and attacking.
Access Benchmarks in WebReports
See Where YOUR TEAM Stands
Now see where YOUR TEAM stands just by going to WebReports. Select your team and click Benchmarks on the Matches page. Compare your team's ranking against national stats by Skill and predicted Win Rate. Know where you stand early in your season and improve the skills that matter to help you accelerate your Win Rate.
How to Use Benchmarks
Set Realistic Goals
Compare your team's current stats to benchmarks for your age group. Set goals to reach benchmark levels by mid-season or end of season.
Identify Strengths and Weaknesses
Find areas where your team exceeds benchmarks (strengths) and areas below benchmarks (weaknesses). Focus practice time on improving weaknesses.
Track Progress Over Time
Use benchmarks as a baseline, then track improvement relative to benchmarks throughout the season. See if you're closing the gap.
Prioritize Practice Time
Focus practice time on skills that are significantly below benchmarks. These areas offer the greatest opportunity for improvement and will have the biggest impact on win percentage.
Related Resources
WebReports
Access benchmarks directly in WebReports for automatic comparison with your team's stats.
Trend Reports
Track your team's improvement over time and see how you're progressing relative to benchmarks.
Data-Driven Volleyball
Learn how to use stats effectively to drive real improvement, not just track numbers.
Starter Bundle
Get access to WebReports and performance benchmarks with the Starter Bundle subscription.